I request all visitors to visit http://www.nseequityguide.blogspot.com for any further posts. Due to technical problems we want to redirect all our visitors to https://nseequityguide.blogspot.com/ . Sorry for the inconvinence .
Regards
AM
I request all visitors to visit http://www.nseequityguide.blogspot.com for any further posts. Due to technical problems we want to redirect all our visitors to https://nseequityguide.blogspot.com/ . Sorry for the inconvinence .
Regards
AM

Shown above is the 60 mins chart of Nucleus software. Chart looks extremely strong with a strong breakout and good momentum. Buy for target 198 stoploss below 186..
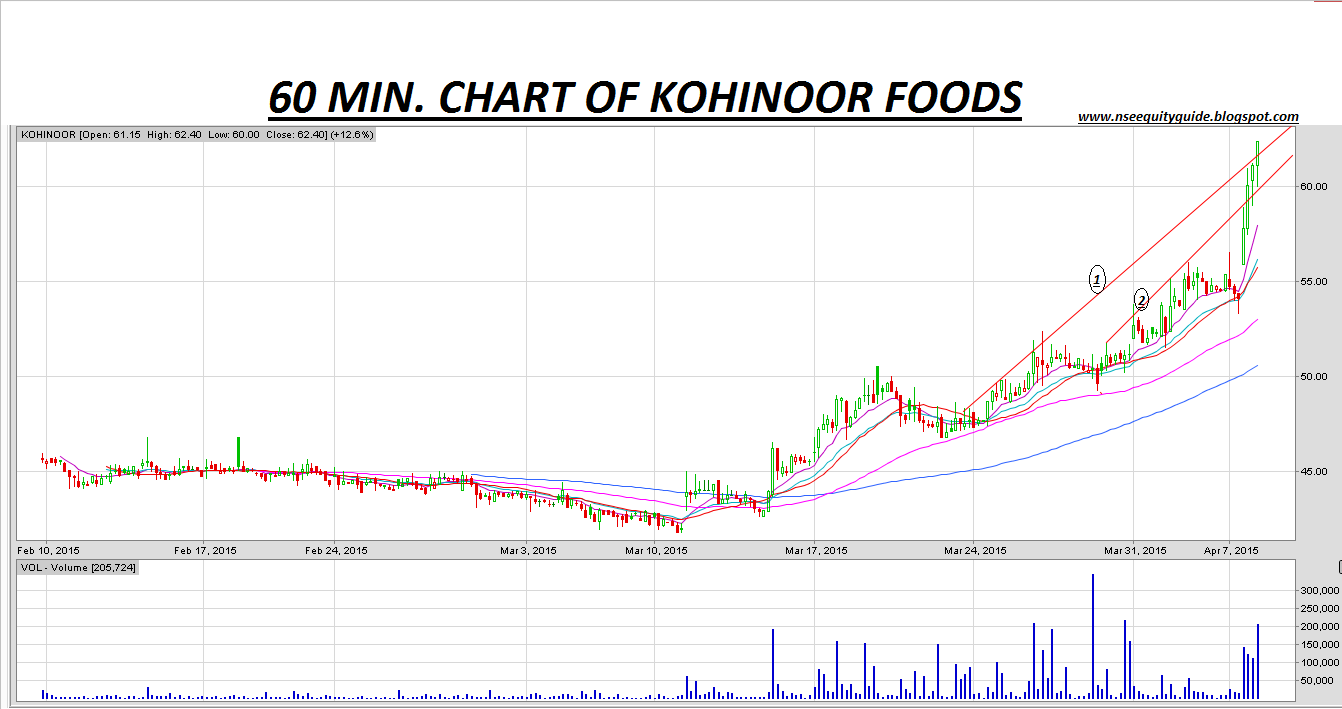
Shown above is the 60 mins chart of
Kohinoor Foods. The stock, in yesterday’s trading session witnessed a huge rally driven by high volumes. Ending around 12% high the stock has given multiple breakouts as visible by line 1 and 2. For the past one year this stock was facing stiff resistance at 61 odd levels, but in yesterday’s trading session it has surpassed the level on back of high volumes. Despite the current rally charts suggest that it has more room on the upside.The moving averages are well placed on daily and weekly charts. It seems like the stock has geared up for a big up move. But for the day buy the stock above 62.4 for targets of around 64.5-65.5 levels. Keep a strict stoploss below 60 levels.

THE LEVELS MENTIONED BELOW ARE SPOT LEVELS.
Shown above is the 60 minutes chart of Voltas. As we can see the stock has given multiple brekouts in today’s trading session. The stock has given a breakout of an inverted head and shoulder pattern and also of a triple top unlocking its higher levels. The moving averages are supporting the trend. Therefore, I am expecting the stock to gear for levels if 305-307. It will be safer to buy the stock above 296 and maintain stop loss below 287.
INTRADAY CALL FOR WEDNESDAY(8-04-2015).

Shown above is the 60 minutes chart of Suven Lifesiences. As we can see that the stock has given a breakout in today’s trading session. The stock has given a triple top breakout and also a trend line breakout marked as ‘2’. The moving averages are also supporting the trend. The stock has also given a breakout of a triangle in 5 minutes chart and has rested on the upper band of the triangle. Therefore, I am expecting the stock to gear for levels of 327-330. It would be safer to buy the stock above 319 and maintain a stop loss below 310.
Kitex Garments bought at 653 profits booked at 673 +3.06%
Suzlon bought at 28.7 booked profit at 29.5 +2.79%
Skf India bought at 1515 booked profit at 1520 +0.33%
GROSS PROFIT +6.18%
Apollo tyre bought future one lot at 178 profit booked at 181.4 +6800INR
TOTALPROFIT +6.18% +6800INR
Continue to hold HDIL as BTST call. Charts still appear good can do well.

CMP: 29.50
BUY SUZLON FOR TARGETS OF 29.70-29.80 AND STOP LOSS BELOW 27.70 …….CMP IS 28.70

Shown above is the daily chart of Kitex Garments. As we can see on the chart that the stock has given breakouts of firm resistances with higher volume. The stock has given a breakout of an upward sloping trend line and a very long consolidation range which was proving to be a good resistance for the stocks. Also the moving averages are lined up for a outburst. Therefore, I suggest to buy the stock for targets of 670-675 maintaining a stop loss below 635.
